Tableau CRM is a powerful cloud-based analytics and business intelligence (BI) solution on the Salesforce platform. It integrates Salesforce data with external data and provides the ability to analyze large datasets while performing predictive analytics.
The CRM Analytics app rebrand paints an exciting picture of the future with Slack. This will help integrate data directly with your company’s collaboration channels, making analytics more collaborative and actionable.
Understanding Salesforce CRM Analytics
Salesforce CRM Analytics is a powerful tool that allows businesses to analyze their customer data effectively. By providing insights into customer behavior, sales trends, and overall business performance, it empowers organizations to make informed decisions.
The Three Pillars of Real-Time CRM Analytics
Getting this right isn’t just a matter of plugging in a new tool. It requires three foundational components working together.
1. Live Data Connectivity
The starting point is reducing data lag to near zero. This is achieved through native CRM APIs and webhooks. APIs allow external systems to programmatically access and push data into your CRM. Webhooks go a step further — they’re automated triggers that fire the moment a specific event occurs, like a deal stage change, instantly pushing that data to your analytics layer.
Together, they ensure your analysis is always working with current information, not yesterday’s export.
2. An Automated Processing Layer
Raw CRM data rarely arrives clean. This middleware layer handles the essential work of cleansing, normalizing, and enriching data — without requiring a data engineer every time a field is renamed or a new input is added. It also handles dynamic calculations: customer lifetime value, average deal cycle length, churn risk scores — derived automatically as data flows in.
The key value here is resilience. A well-built processing layer absorbs CRM schema changes without breaking, keeping your analytics running cleanly as your CRM evolves.
3. An Investigation and Insight Layer
This is where the real transformation happens. Instead of a dashboard that says “revenue dropped in the Southeast,” a proper investigation layer tells you why — for example, that two enterprise accounts in the region downgraded, that the downgrade coincided with a 15% spike in their support tickets, and that a new competitor entered the market with aggressive pricing during the same window.
This layer enables multi-hypothesis testing, drill-down from macro to granular, and predictive modeling — all without requiring business users to write SQL or wait on data teams.
Why Do I Need Tableau CRM?
Tableau CRM (Salesforce CRM Analytics) is a powerful analytics platform that will enhance the reporting capabilities within your Salesforce org. The platform can take data from any source and automatically analyze rows of that data (even millions!) to help your organization answer critical questions in a quick and visually appealing format.
Here’s another amazing feature – Tableau CRM is now available (an optimized) via mobile, so your team can view insights from any device, even if they are not in the office.
The Future of AI in CRM
The global CRM market is projected to reach $112 billion by 2025, with AI in CRM expected to grow to $11.04 billion. This growth is driven by:
- Increased adoption of generative AI CRMs by 65% of businesses.
- 91% of companies with 10+ employees using CRM software.
As AI technology continues to evolve, tools like SuperAGI are emerging, offering advantages such as faster deployment and reduced costs compared to traditional platforms like Salesforce.
How Does Tableau CRM Get the Data?
There are multiple options for leading data into Tableau CRM using connectors. You are able to connect data inside and outside of your Salesforce org with data from external applications, databases, and data warehouses.
The various connectors help to bring your data into one place so you can analyze and share it with any Salesforce user. If your company handles sensitive data, you can ensure that the objects and fields holding that data are not being extracted to Tableau CRM.
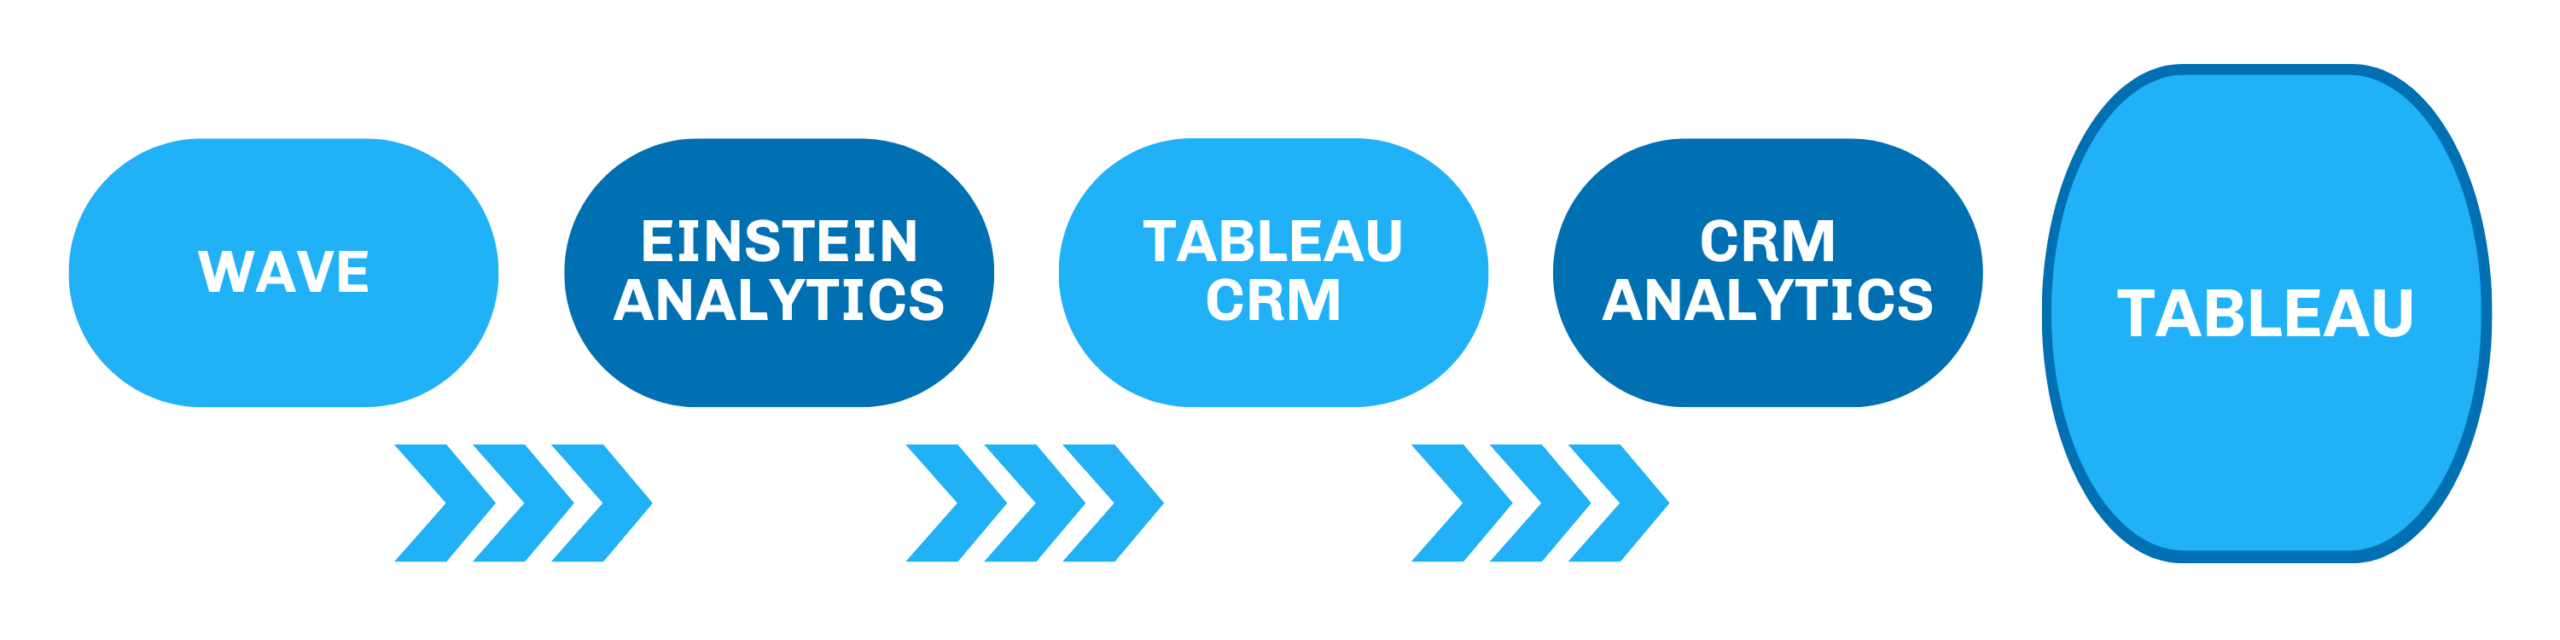
What is the Difference Between Tableau and Tableau CRM?

Tableau has a large portfolio of products that includes Tableau CRM, as shown in the image above. The Tableau platform can be either on-premise or in the cloud depending on the products you choose. It would not live within Salesforce, so any users can have access to your dashboards as long as you provide them with a license. It is the best tool for companies looking for an enterprise-wide BI solution, especially if your company requires remote, federated queries.
Tableau CRM, in relation to other Tableau products, is ideal for companies who want their BI tool to be integrated with their Salesforce CRM system. This product also brings in Einstein features so you can easily embed AI and supervised machine learning into your reporting and CRM. There are also templated apps that your organization can use and quickly update to meet your analytics requirements using your Salesforce data.
Having the insights from your reporting directly in Salesforce is perfect for companies that want to perform actions natively in the Salesforce platform based on the analytics.
How Do You Access Tableau CRM From Salesforce?
Now that you have a fair understanding of Tableau CRM, you may be wondering how you can access it in your Salesforce org. First, ensure that your organization has reviewed the Tableau CRM pricing page and acquired the appropriate licenses to use the tools.
To enable Tableau CRM, you will need to go into your Salesforce Setup and enter Analytics in the Search area. From there, you will go to the Getting Started section and click on Enable CRM Analytics. You should ensure that all users who will need access to CRM Analytics have the appropriate permission sets.
To actually access Tableau CRM you will need to open your app launcher and find the Analytics Studio tile amongst the different apps in your org.

Ways to Use Tableau CRM
If you are brand new to Tableau CRM, it is highly recommended that you check out some common app templates to help you determine where to begin on your analytics journey. I have outlined below some of the more common app templates you can quickly deploy for your team to start getting valuable insights right away.
Pipeline Analytics
The Pipeline Analytics Template is perfect to get an overall view of your company’s sales pipelines, while introducing a ready-made waterfall dashboard. You will have the ability to dive deeper into your pipeline insights and filter on various fields such as Account Name, Stage Name, and Forecast Category.

Service Analytics
The Service Analytics Template brings together prebuilt dashboards that showcase your current service data across multiple lenses, including your company’s key service performance indicators, all in one place. Your managers will be able to see total cases, average wait time, and average handle time, as well as how these insights change overtime. There are a total of 17 dashboards provided with this template, ensuring you can answer all of your service related business questions.

B2B Marketing Analytics
Finally, as a Pardot Consultant, I must mention the B2B Marketing Analytics template that is available for Pardot customers with the Plus, Advanced, and Premium Pardot editions (with Salesforce Enterprise Edition or higher). This template offers three main dashboards for you to view, with the potential for three additional dashboards if you follow a few additional steps.
These dashboards answer the main question with Pardot reporting: How can I connect my Pardot and Sales Cloud data in a comprehensive view? My favorite pre-built dashboard is the Pipeline dashboard, which shows the lifecycle of your customers from visitors to your website, all the way to closed-won opportunities.


Do I Have to Pay More to Get Tableau CRM?
There are four editions which are all sold separately from every other Salesforce product, including Sales Cloud and Service Cloud. Each addition provides different features such as Einstein Discovery, Revenue Insights, and Einstein Prediction Builder.
It is worth noting that you can access some Tableau CRM features (if you have a Pardot account with a Plus edition or higher) through B2B Marketing Analytics. B2B Marketing Analytics brings five out-of-the-box dashboards to help marketers view their data as soon as possible.
Key Tableau CRM Terms
Finally, it’s important to note that Tableau CRM uses terminology that can be challenging to understand at first. Here are five you need to know:
1. App
An app can be considered the heart of organization within Tableau CRM. It can be compared to folders in Salesforce reporting as it can store multiple items within it such as lenses, dashboards, and datasets – in any combination.
Similar to Salesforce reporting, you are able to control sharing for each app to ensure that the right people are able to view contents – it’s recommended to divide up your apps as they apply to different projects, departments, or teams. Tableau CRM apps provide the opportunity for every user on your team to explore data, uncover insights, and take action from any device.
2. App Template
These are pre-built analytics apps for some of the more common use cases and departments using Salesforce. They are amazing for companies who are just getting started with Tableau CRM and need some quick wins to show insights right away.
As these are pre-built and the templates are generic, they work best with organizations that do not have many customizations in their Salesforce environment. They are also very beneficial as each template provides an overview of the insights you will be able to view, as well as the Salesforce objects driving these insights – this provides you with a clear picture of the questions your new dashboard can help to answer.
3. Dashboard
Tableau CRM dashboards are similar to those available with native Salesforce dashboards in the sense that they are composed of charts, metrics, and tables to help provide data insights. This is where the similarities stop, however, as Tableau CRM dashboards are so much more powerful. They are able to tell a story with your data, and have additional features such as Interactions, Faceting, and Filtering to help your team drill down, group, and even pivot your data to their needs.
4. Dataset
Datasets are collections of relevant data that are stored in a denormalized form to help optimize interactive exploration. This formatting will help with query speeds and ultimately ensure that your organization’s dashboards and lenses don’t run into performance issues (as some Salesforce reports do). You are also able to combine multiple data sources into a single dataset to help ensure your data comes together in a single view.
5. Lens
If Tableau CRM dashboards can be compared to Salesforce dashboards, then “lenses” can be compared to Salesforce reports. Lenses are typically used to explore the datasets you have built to answer single business needs. Similar to reports, they can be saved and shared on their own or they can be added to a dashboard to help tell a story across multiple lenses and data sources.